![Portland Multifamily Market Stabilizing as Suburban Markets Lead Recovery [4/08/26]](https://www.hfore.com/wp-content/uploads/2026/04/Spring-2026-Portland.png)
Portland Multifamily Market Stabilizing as Suburban Markets Lead Recovery [4/08/26]
The Spring Apartment Report is here! Click to download: [MFNW spring 2026 Apt Report]
VACANCY
The Multifamily NW Spring 2026 survey of nearly 29,300 units across the Portland-Vancouver metro area reports an overall vacancy rate of 6.25%, up from 5.85% in Spring 2025 — a 7% year-over-year increase.
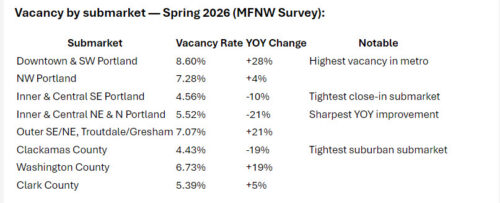
MFNW vacancy by submarket
The MFNW data confirms the widest divergence in the market: Downtown & SW Portland lead all submarkets with an 8.6% vacancy rate — a 28% year-over-year increase — while Inner & Central NE Portland and Clackamas County both improved sharply and now represent the market’s tightest conditions. Suburban and exurban submarkets, particularly Clark County, Vancouver, and Yamhill County, have proven far more resilient through the supply cycle than the urban core. Vancouver continues to stand out, with vacancy declining around 250 bps since 2024 even as it absorbs 25%–40% of regional deliveries each year, reflecting strong demand from renters attracted by Washington’s tax advantages and expanding employer base.
The biggest risk to the vacancy outlook is Portland’s weak labor market. CoStar notes that if household formation stalls in middle-market (3 Star) communities — the market’s largest and most price-sensitive segment — vacancy could increase even with minimal new supply.
Portland’s overall vacancy rate peaked at 7.9% in Q4 2024 and has since decreased to 7.5% as of Q2 2026, according to CoStar.
The Multifamily NW Spring 2026 survey, which covers nearly 29,300 units across the Portland-Vancouver metro, shows an overall vacancy of 6.25%, up from 5.85% in Spring 2025 — a 7% increase year-over-year.
The difference between these two sources reflects CoStar’s broader, metro-wide inventory compared to MFNW’s survey respondent pool; both indicate a similar trend of modest softening, with significant variation by submarket. Portland is a large, growing metro area with about 2.54 million residents that leads the Pacific Northwest multifamily investment market.
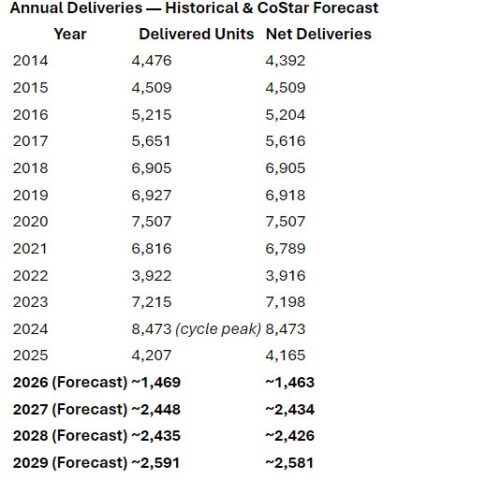
The region is coming out of its most supply-heavy construction cycle in decades, with 8,473 net deliveries expected in 2024, marking a generational high. Since then, the pipeline has slowed significantly: groundbreakings have averaged fewer than 500 units per quarter for four of the last five quarters, and 2026 is expected to have the fewest deliveries in the past decade.
Vacancy has decreased from its Q4 2024 peak of 7.9% to 7.5% as of April 2026 according to CoStar; the Multifamily NW survey of around 29,300 units shows a 6.25% market-wide vacancy rate in Spring 2026, up from 5.85% a year earlier.
Rent growth remains negative at -1.0% year-over-year as the final phase of luxury deliveries fills up. CoStar predicts positive annual rent growth will return by the end of 2026 and stabilize at 2%–3% annually through 2030.
Studios remain the most available unit type at 9.53% vacancy. Three-bedroom units are the most occupied at 4.28% vacancy overall.
Click here to download the Multifamily NW Spring Apartment Report
RENT
This three-year period of essentially flat or declining rent growth has coincided with sharp increases in operating expenses — including payroll, administrative costs, supplies, legal fees, utilities, advertising, taxes, and especially insurance. According to market sources, expense hikes of 20% or more over the three-year span were common, varying by location, age, and asset quality. The combination of stagnant revenue and rising costs has significantly reduced NOI and net operating returns across the portfolio.
Luxury and mid-tier products face the most pressure due to lease-up concessions. Two to three months of free rent are common at new urban properties. Suburban operators in less-saturated areas typically offer four to six weeks free. Flat renewals are widespread in Downtown, Northwest, and Southeast submarkets. Utilitarian 1- and 2-star products are the only ones performing well, benefiting from renter trade-down and almost no new supply competing for tenants.
CoStar forecasts rent growth will pick up by the end of 2026 and turn clearly positive in 2027, mainly due to a supply-demand imbalance that will worsen as new groundbreakings stay low. CoStar’s current rent forecast: flat for 2026, then 1.5%–2.5% annually through 2030.
The pipeline has dropped sharply from the three-year peak of 11,000 units in progress during Q1 2023. Groundbreakings in four of the last five quarters totaled fewer than 500 units each, marking the slowest pace of construction in ten years. For comparison, a decade-high of 3,500 units broke ground in Q1 2022. Luxury and mid-tier products face the most pressure due to lease-up concessions. Two to three months of free rent are common at new urban properties. Suburban operators in less-saturated areas typically offer four to six weeks free. Flat renewals are widespread in Downtown, Northwest, and Southeast submarkets. Utilitarian 1- and 2-star products are the only ones performing well, benefiting from renter trade-down and almost no new supply competing for tenants.
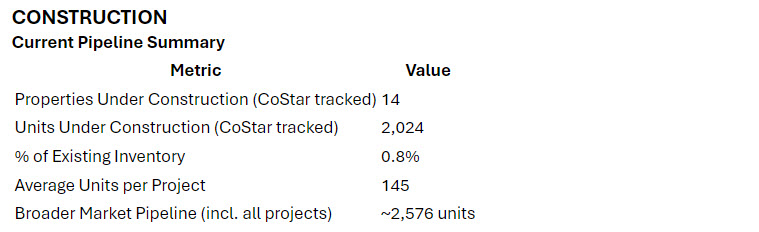
The MFNW report describes the construction outlook as “dismal”: Portland Metro is now in its 16th straight quarter of declining development, with the last increase in units under construction recorded in Q2 2022. CoStar reports around 2,500 market-rate units under construction across the metro area — levels similar to those seen in 2011 and 2012. Total 2026 completions are forecasted at about 1,463–1,500 net units, which CoStar identifies as the low point for this cycle; new deliveries are not expected to pick up significantly until 2027.
The City of Portland reports that 1,720 units have expressed interest in its SDC (System Development Charge) waiver program, though many of these projects remain in the early planning stages with no guarantee of breaking ground. Vancouver continues to dominate the pipeline, accounting for more than 50% of units currently underway.
Why development remains stalled: Replacement costs still surpass what properties are worth, removing the financial motivation for new market-rate projects. Lending is limited, with few lenders active in construction. Even with slight rate improvements, most projects don’t add up under current assumptions. Many lenders stay cautious due to recent issues in newly built assets. Public officials are starting to pay attention, but any policies to stimulate new supply are still years away. The pipeline has dropped sharply from the three-year peak of 11,000 units in progress during Q1 2023. Groundbreakings in four of the last five quarters totaled fewer than 500 units each, marking the slowest pace of construction in ten years. For comparison, a decade-high of 3,500 units broke ground in Q1 2022.
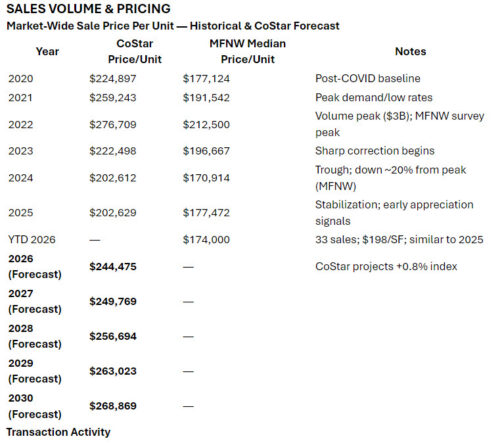
Transaction activity in the Portland Metro multifamily market rebounded meaningfully in 2025. Per appraiser Patrick Barry (Barry & Associates), the year closed with 174 sales across the four-county metro region — a 39% increase from the 125 transactions recorded in 2024. While activity remains below the long-term average of just over 200 annual sales, the uptick provides a meaningful measure of confidence for market participants who rely on deal flow.
Total 2025 sales volume held stable at approximately $1.75 billion, indicating a decline in average deal size as transaction count expanded. The increase in deal volume suggests buyer confidence returning across a broader segment of the market. The steepest price correction appears to be behind the market: values appear to have bottomed in mid-to-late 2024, with 2025 showing clear signs of stabilization and early appreciation alongside increased sales activity. A full recovery to peak 2022 pricing is now projected to extend beyond 2031.
Market Segments: Who Has Fared Better
Suburban locations (Clackamas, Clark, Washington Counties): As challenges within the City of Portland have intensified — including regulatory uncertainty, public safety concerns, and elevated tax burdens — investor preference has increasingly shifted toward suburban markets. Per MFNW data, suburban assets have not been immune to softening, with median price per unit declining 4.2% in 2025 ($164,072). However, they continue to be viewed as offering a comparatively stable long-term outlook relative to urban assets.
Newer construction (built since 2010): Another segment facing notable pressure, particularly within the City of Portland. Median pricing for post-2010 urban Portland properties was approximately $211,153 in 2024, with partial recovery to $223,430 in 2025. Comparable suburban product (Portland/Salem Metro, outside Portland city limits) has fared better, with 2025 median prices near $250,606. Many recently constructed urban assets are facing a pivotal decision as construction loans mature or require restructuring: accept current losses and redeploy capital, or contribute additional equity and hold through the cycle.
Pre-1940 historic buildings in the City of Portland: The most challenged segment. Median price per unit is down approximately 39% since 2023, with 2025 pricing now aligning with values last seen in 2013 (~$107,669/unit). Headwinds include difficulty securing insurance, smaller unit layouts less suited to work-from-home trends, livability concerns, elevated maintenance costs, constrained financing, and growing City of Portland tax exposure. A growing number of these assets are now being actively marketed, suggesting the segment may still be in the process of finding a pricing floor.
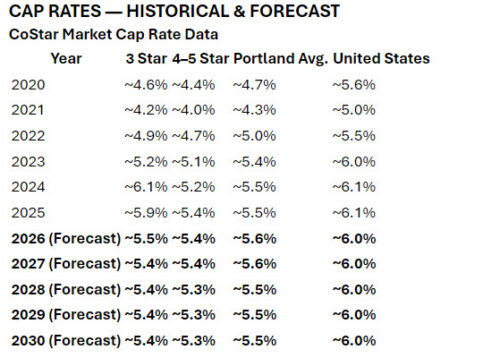
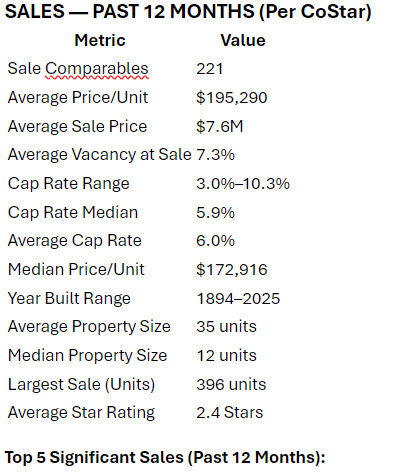
CoStar indicates that overall capitalization rates have remained relatively stable over the past 12 months, hovering around 6.10% — consistent with feedback from national surveys and discussions with local market participants. As the MFNW report emphasizes, changes in values are highly dependent on building type and location; cap rates for distressed or vintage urban assets trading well above this average, while core suburban and newer suburban product is pricing tighter.
Portland vs. U.S. Outlook (2026–2030): Portland continues to trade at a meaningful discount to the national cap rate average — roughly 40–60 basis points below the U.S. average throughout the forecast period. The 4–5 Star segment in particular is forecast at ~5.3–5.4% through 2030, reflecting continued institutional appetite for core urban Portland product. CoStar’s price index projects steady appreciation through 2030, targeting ~$268K/unit overall and ~$348K/unit for the luxury tier by 2030.
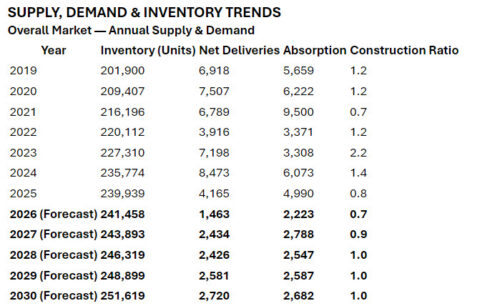
The 2022–2024 period was defined by an acute supply overhang: deliveries peaked at 8,473 units in 2024 while absorption topped out at 6,073, producing a construction ratio of 1.4x. The most damaging year was 2023, when 7,198 units were delivered against only 3,308 absorbed — a 2.2x ratio that drove vacancy from 5.6% to 7.1% in a single year. The market began self-correcting in 2025, with absorption (4,990 units) exceeding deliveries (4,165 units) for the first time since 2021. This trend accelerates in 2026, with a forecast of only 1,463 net deliveries against 2,223 units absorbed — a 0.7x construction ratio that will drive meaningful vacancy compression. CoStar forecasts supply-demand balance (construction ratios near 1.0x) from 2027 through 2030 as groundbreakings gradually recover.
The 4 & 5 Star segment shows a particularly stark story: after the luxury tier expanded by 8.7% in 2024 alone (6,351 net units) against absorption of just 4,003 units, the segment is now forecast to add only 1,244 units in 2026 while absorbing 2,019 — a 0.6x construction ratio. This is the supply normalization that will ultimately clear the luxury concession overhang and restore pricing power to the upper tier.
Population Growth & Housing Demand Context
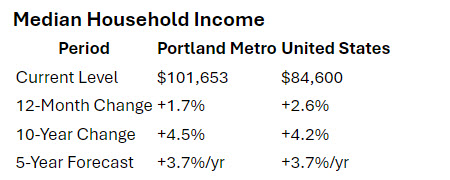
Portland’s metro population adds approximately 10,000–12,000 residents annually at the current growth pace. At an average household size of ~2.45 persons, this translates to roughly 4,100–4,900 new households per year. CoStar forecasts 0.9% annual household growth over the next five years — approximately ~9,350 new households/year based on a current base of ~1,038,837 households. Against forecast deliveries of just 1,463–2,720 units annually through 2030, the Portland metro will see demand substantially outpace new market-rate supply, providing structural support for vacancy compression and a multi-year rent growth recovery.
However, the market’s near-term demand story is constrained by Portland’s employment weakness. With job growth running last among the nation’s top 54 metros at -0.42%, household formation is at risk of underperforming demographic projections if current economic headwinds persist.
MULTIFAMILY INSURANCE MARKET SUMMARY
(Source: Mike Nielsen, Nielsen Insurance, Inc., via MFNW Spring 2026 Report)
The multifamily insurance market has experienced significant changes in recent years. While premiums have risen notably, underwriting scrutiny has increased markedly as well. Carriers are leveling off slightly in premium increases, but underwriters continue to focus on specific property characteristics tied to profitability.
Most carriers now require that certain building systems have been upgraded within the last 30 years — a standard that supersedes the traditional argument that a system was code-compliant at the time of construction. Key systems frequently requiring modification or replacement include:
-
Electrical: Panels including Zinsco, GTE Sylvania, FPE Stab-lok, Square D, Challenger, and Pushmatic Bulldog brands often require replacement
-
Plumbing and HVAC: Upgrades typically required if systems predate the 30-year threshold
-
Roofing: Current condition and age closely scrutinized
-
Pool fencing: Must be 5′ height, non-climbable, with self-closing/self-locking latch
-
Stair balusters and balcony railings: Non-climbable with maximum 4″ spacing
-
Site maintenance: Raised cement, unstrapped water heaters, trees overhanging structures, and inadequate lighting are commonly cited deficiencies
Proactive ownership — conducting regular inspections, maintaining detailed maintenance records, and addressing recommendations before they become carrier mandates — has become essential to stabilizing insurance programs and avoiding premium escalation. For owners of older assets, insurance risk management must now be considered a core operational function, not a periodic administrative task.
MULTIFAMILY FINANCING: WHAT TO KNOW IN 2026
(Source: Matt Illias, Senior Managing Director/Partner, Ethos Commercial Advisors, via MFNW Spring 2026 Report)
Multifamily financing in the Pacific Northwest remains active in 2026, though the market is more selective than a year ago. Capital is available across construction, bridge, and permanent debt, but lenders are placing greater weight on sponsorship quality, liquidity, and execution certainty.
Interest rates: The 10-year Treasury began 2026 at 4.19%, declined to 3.97% on February 27, then climbed back to 4.30% by March 31. One year earlier it stood at 4.20% — making rates look relatively unchanged on paper. In practice, the fluctuation created a meaningfully different experience for borrowers with loans in application but not yet rate-locked. Because most multifamily loans are debt-service-coverage-constrained, even modest Treasury rate movements meaningfully reduce loan proceeds.
Agency lending: Fannie Mae and Freddie Mac remain core sources of liquidity for stabilized multifamily. Agency spreads generally land in the range of 100–170 basis points over the corresponding Treasury, with the sharpest pricing reserved for lower leverage and stronger debt coverage. What has shifted over the past year is not so much agency appetite as agency preference: stronger sponsorship, deeper operating history, and larger ownership platforms are carrying more weight in underwriting, favoring institutional-quality borrowers and established portfolio owners.
Banks, credit unions, and life companies: These lenders across the Northwest remain highly competitive, in many cases offering attractive fixed-rate executions and flexible structures — including non-recourse options, varied term lengths, and interest-only periods that compare favorably with agency financing.
Bridge and construction financing: Bridge capital is readily available for construction takeouts and for newer assets that need time to stabilize. Debt funds, life companies, and select banks continue to show appetite, though spreads have widened modestly. Traditional value-add bridge deals, however, are less common — higher borrowing costs paired with flat rent growth have made renovation-driven strategies harder to underwrite unless the going-in basis is especially attractive. Construction financing is showing improvement, with more banks, regional lenders, and credit unions returning to the market and leverage generally moving higher for stronger projects. The primary obstacle for many sponsors is not the debt — it is filling the equity portion of the capital stack at a level that still allows projects to move forward.
STATE TENANT PROTECTION ORDINANCES
The most significant recent development at the local level involves Oregon’s Oregon HB 4123 (passed both chambers in February–March 2026 and awaiting Governor signature as of late March 2026) adding tenant privacy and confidential information rules to ORS Chapter 90, restricting landlord disclosure of tenant personal data with statutory damages of twice the monthly rent for violations.
ECONOMY
Employment
Portland’s total employment base stands at 1,249,000 jobs (Location Quotient of 1.0 vs. the national average). Annual employment growth currently ranks last among the top 54 U.S. metros at -0.42% — a significant headwind for multifamily demand. This is in contrast to the national rate of +0.27%.
Manufacturing — home to Intel’s massive Hillsboro R&D campus — has faced headwinds from restructuring and layoffs, though Intel has committed to a $36 billion long-term upgrade of its Hillsboro facilities. Nike (Portland’s largest Fortune 500 headquarters) recently completed a 1.4 million SF office expansion. The most significant demand catalyst on the horizon is OHSU’s $650M hospital expansion, expected to add approximately 3,000 permanent jobs when it opens in 2026–2027, with an additional $330M Doernbecher Children’s Hospital expansion underway.
Population
The Portland metro population stands at 2,555,165 as of Q2 2026, growing at 0.4% annually — in line with the national rate of 0.3% and placing Portland 35th among major U.S. metros. Internal migration within the metro is uneven: Multnomah County is experiencing essentially flat population growth, while Clark County is growing at more than double the broader metro rate.
Unemployment
Portland’s unemployment rate stands at 4.8%, modestly above the national rate of 4.5%, and has been rising (up 0.5% over the past 12 months vs. +0.4% nationally). The labor force itself has contracted 0.4% over the past year (vs. +0.2% nationally), reflecting both a slowing workforce and some outmigration. Portland’s GDP ranks 30th nationally, with real GDP growth of 1.6% (ranking 52nd among peer metros).
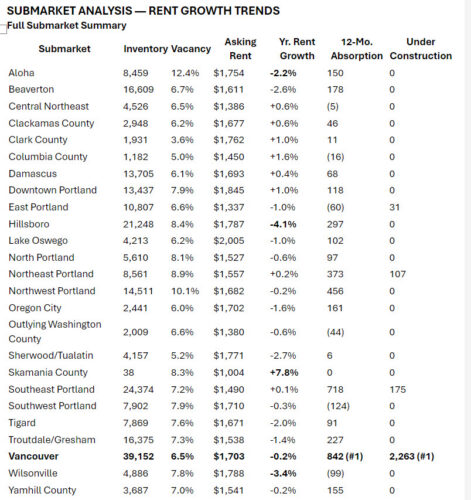
Skamania County (+7.8%) posts the market’s strongest rent growth, though its tiny size (38 units) makes this a statistical outlier.
Columbia County (+1.6%) is the most credible outperformer among meaningful-sized submarkets. With zero units delivered in the past year and no pipeline under construction, affordability-driven renter demand is supporting pricing well below the metro average ($1,450/month).
Clark County (+1.0%) and Downtown Portland (+1.0%) both post solid gains. Clark County benefits from Washington’s tax advantages and a 3.6% vacancy rate — the lowest in the entire metro — with no new construction in the pipeline. Downtown Portland’s 1.0% gain reflects recovery in stabilized assets as luxury lease-up properties from prior cycles gradually absorb.
Southeast Portland (+0.1%) and Northeast Portland (+0.2%) are essentially flat but trending in the right direction. Southeast’s 718-unit absorption rank — second in the entire metro — demonstrates healthy leasing velocity. The MFNW survey corroborates this relative strength: Inner & Central SE Portland carries a 4.56% vacancy rate, one of the tightest readings anywhere in the metro.
Submarkets Seeing Rent Declines
Hillsboro (-4.1%) is the market’s weakest performer on rent growth. The Intel/tech corridor has faced significant employment pressure from Intel’s restructuring, depressing renter demand even as existing units absorb. Effective rent growth was -5.4% — the worst in the metro.
Wilsonville (-3.4%) and Sherwood/Tualatin (-2.7%) are both suburban Southwest communities with negative effective rent growth in excess of -3.5%, driven by negative net absorption despite zero new deliveries. These are demand-side problems, not supply-side.
Aloha (-2.2%) carries a startling 12.4% vacancy rate, the highest in the entire market. Aloha experienced aggressive deliveries recently (455 units, a 5.4% inventory expansion) relative to its size, driving vacancy dramatically above market norms.
Beaverton (-2.6%) similarly absorbed only 178 units against 285 new deliveries, contributing to 6.7% vacancy and negative effective rent growth of -3.1%.
Why the Differential?
The pattern is consistent: submarkets with recent aggressive deliveries relative to their size are seeing the steepest rent declines (Aloha, Hillsboro, Beaverton, Sherwood/Tualatin). Submarkets with supply constraints and/or affordability advantages are performing best (Clark County, Columbia County, Damascus, Yamhill County). Vancouver is the most important story — it simultaneously absorbs the most units in the region (#1 at 842 units) AND carries 88% of the entire construction pipeline (2,263 of 2,576 market units), yet still maintains a 6.5% vacancy rate and flat rent (-0.2%) because of outsized renter demand from Oregon workers seeking Washington’s income-tax-free environment.
STRATEGIC CONTEXT: THE PACIFIC NORTHWEST WATER ADVANTAGE
(Source: Arie van Gemeren, CFA, The Timeless Investor & Lombard Equities Group, via MFNW Spring 2026 Report)
A theme beginning to surface in Pacific Northwest multifamily conversations — rarely quantified but increasingly worth underwriting — is the region’s structural advantage in fresh water supply. The Pacific Northwest sits on some of the most reliable fresh water in North America, fed by snowpack, rivers, and rainfall patterns that remain structurally intact. This stands in sharp contrast to the Sun Belt markets that have attracted the majority of multifamily capital over the past decade: Phoenix is drawing down the Colorado River, Las Vegas is draining Lake Mead, and Central Valley aquifers that took millennia to fill are disappearing within a generation.
Colorado River Compact
The Colorado River Compact, signed in 1922, allocated water based on the wettest decade in recorded history. Every downstream state has been drawing on borrowed time ever since, and the reckoning is arriving in the form of mandatory cutbacks, political fights, and genuine questions about long-term habitability in some of the fastest-growing metros in the country.
For multifamily investors, this argument plays out in three practical directions:
-
Lower development costs over time. Water-scarce markets are beginning to see impact fees, permitting delays, and infrastructure constraints tied directly to water capacity. That adds cost and friction to new supply — which drives up values for existing owners while making new development harder.
-
More durable long-term tenant demand. Climate migration — still early and underappreciated — is a slow-moving force favoring the Pacific Northwest over the next generation. People follow water.
-
Lower regulatory risk. Jurisdictions under water stress face compounding political pressure, which tends to produce the kinds of interventions — moratoriums, restrictions, mandates — that make operating real estate more difficult and less predictable.
The argument is not that water access replaces traditional underwriting fundamentals — cap rates, rent-to-income ratios, basis, and execution still matter. But in a world where water access is becoming a problem for major competing markets, asking the question — What is this submarket’s long-term water reliability? What’s the trend in water costs? Is new development here being constrained by infrastructure capacity? — may meaningfully inform where capital is deployed over a 10- or 20-year horizon. For Portland, Seattle, and the Willamette Valley, none of that uncertainty applies. That is a structural tailwind that does not appear in any cap rate model — but probably should.
This analysis is based on CoStar Q2 2026 data prepared by HFO Investment Real Estate, supplemented with the Multifamily NW Spring 2026 Apartment Report (Vol. 44), authored by Liz Tilbury, CCIM (Commercial Integrity NW); Patrick O. Barry (Barry & Associates); Mike Nielsen (Nielsen Insurance, Inc.); Matt Illias (Ethos Commercial Advisors); and Arie van Gemeren, CFA (The Timeless Investor & Lombard Equities Group). Additional sourcing: GREA, Kidder Mathews, NWV Group, HFO’s Multifamily Marketwatch, Axios Portland, and Portland.gov. All CoStar forecasts are projections and subject to change.
The Multifamily NW Spring 2026 Apartment Report is produced by Multifamily NW, the association promoting quality rental housing. HFO Investment Real Estate served as the Market Insight Partner for this edition.